Building an Investment Portfolio Optimisation Tool with Python and Table Extensions in Tableau
Some time ago I wanted to create a dynamic tool in Tableau, that enables end users to iterate through different combinations of variables (companies to invest, investment value, etc.), and immediatelly see how their choices impact the output of portfolio optimisation models.
This blog post introduces the Investment Portfolio Optimisation Tool, the project that I presented at the Tableau DataDev Day in June 2024. It showcases the extended capabilities of Tableau’s Table Extensions, and demonstrates how complex financial calculations can be integrated into interactive dashboards.
By combining the analytical power of Python with the visualization capabilities of Tableau, this project demonstrates the exciting possibilities at the intersection of data science and finance. Whether you’re a data enthusiast, a finance professional, or just curious about portfolio optimisation, this tool is a great example of interactive financial analysis.
Important Note: Before we dive in, it’s crucial to emphasize that this tool is designed for educational purposes only. The results are illustrative and should not be considered as investment advice. Always remember that past performance does not guarantee future returns.
Background: how it all started
Originally, I got an idea to build an interactve portfolio optimisation tool in Tableau back in 2021. At that point, the only way to run Python models or calculations in Tableau was to use script functions in calculated fields. These functions work as table calculations, and let you bring only one value per row at a time. So, to find my way around this limitation, I used Jupytab, a webserver built on the basis of Tableau’s Web Data Connector (WDC) and the Jupyter Kernel Gateway. That allowed me to explore the results of optimisation models generated dynamically by functions in my Jupyter notebook directly in Tableau.
However, because of the limitations of script functions, the list of equities was fixed in my Jupyter notebook, and I wasn’t able to allow users to select equities they want to include in their portfolio directly in the dashboard. Moreover, since there were several calculations that needed to run at the same time, the performance of the dashboard was not optimal. Also, the architecture for this project required me to maintain and run two separate servers (TabPy to communicate with Python, and Jupytab to communicate with Jupyter kernel). This made it a complicated and at times brittle setup (see the architecture for this project below).
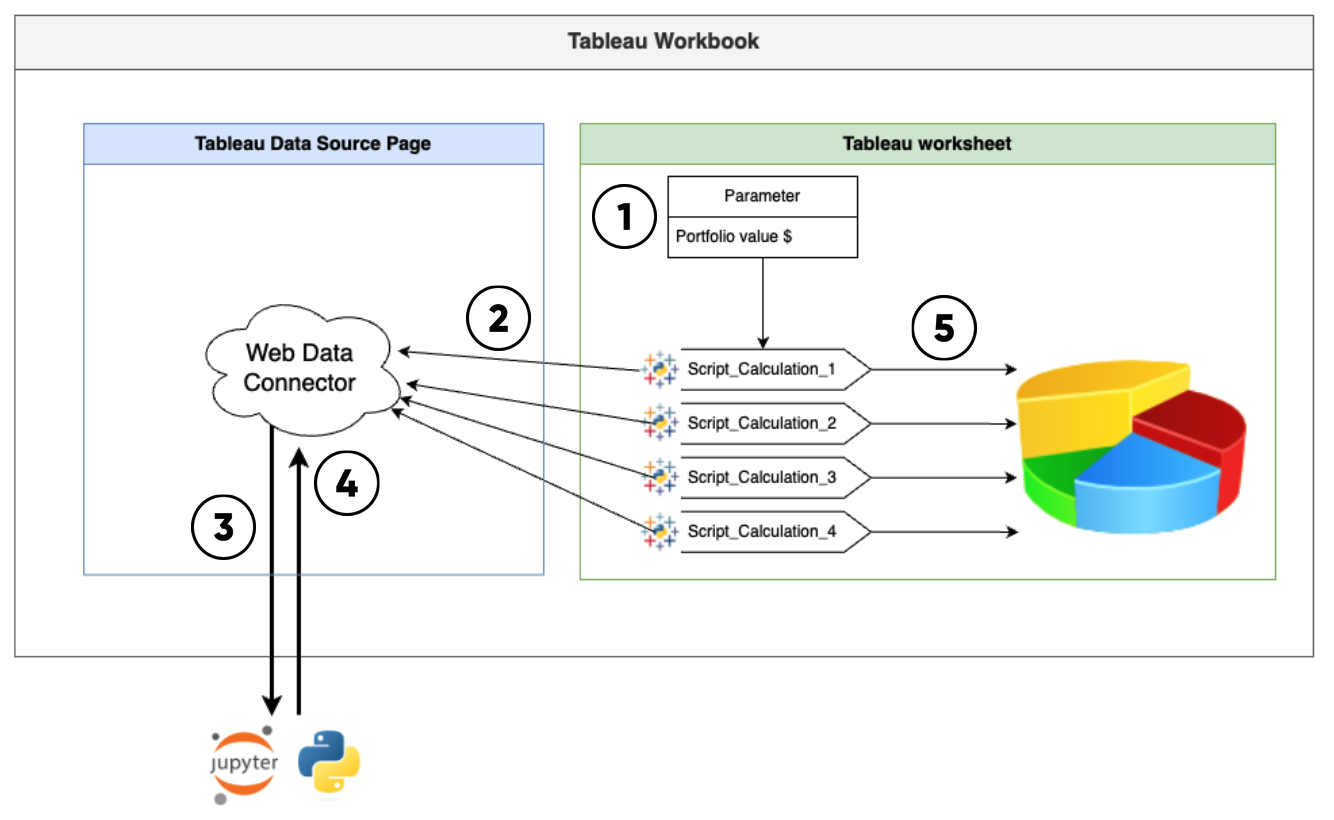
Previous architecture diagram
Finally, Tableau 2022.3 introduced Table Extensions that enabled users to return a complete data set from their Python script back to Tableau to use it as any other data set in the workbook. Later, Tableau 2024.1 added dynamic parameters in Table Extensions, that made it possible to pass parameters from the dashboard to the Python script, and update the output data set accordingly. With these new features, I decided to revisit my original project from 2021.
The power of portfolio optimisation in Tableau
Imagine being able to input your investment preferences and instantly receive optimised portfolio allocations based on sophisticated financial models. That’s exactly what this tool offers. By leveraging two popular portfolio optimisation methodologies - Mean-variance Optimisation and Mean-semivariance Optimisation - users can get tailored investment strategies for their chosen stocks.
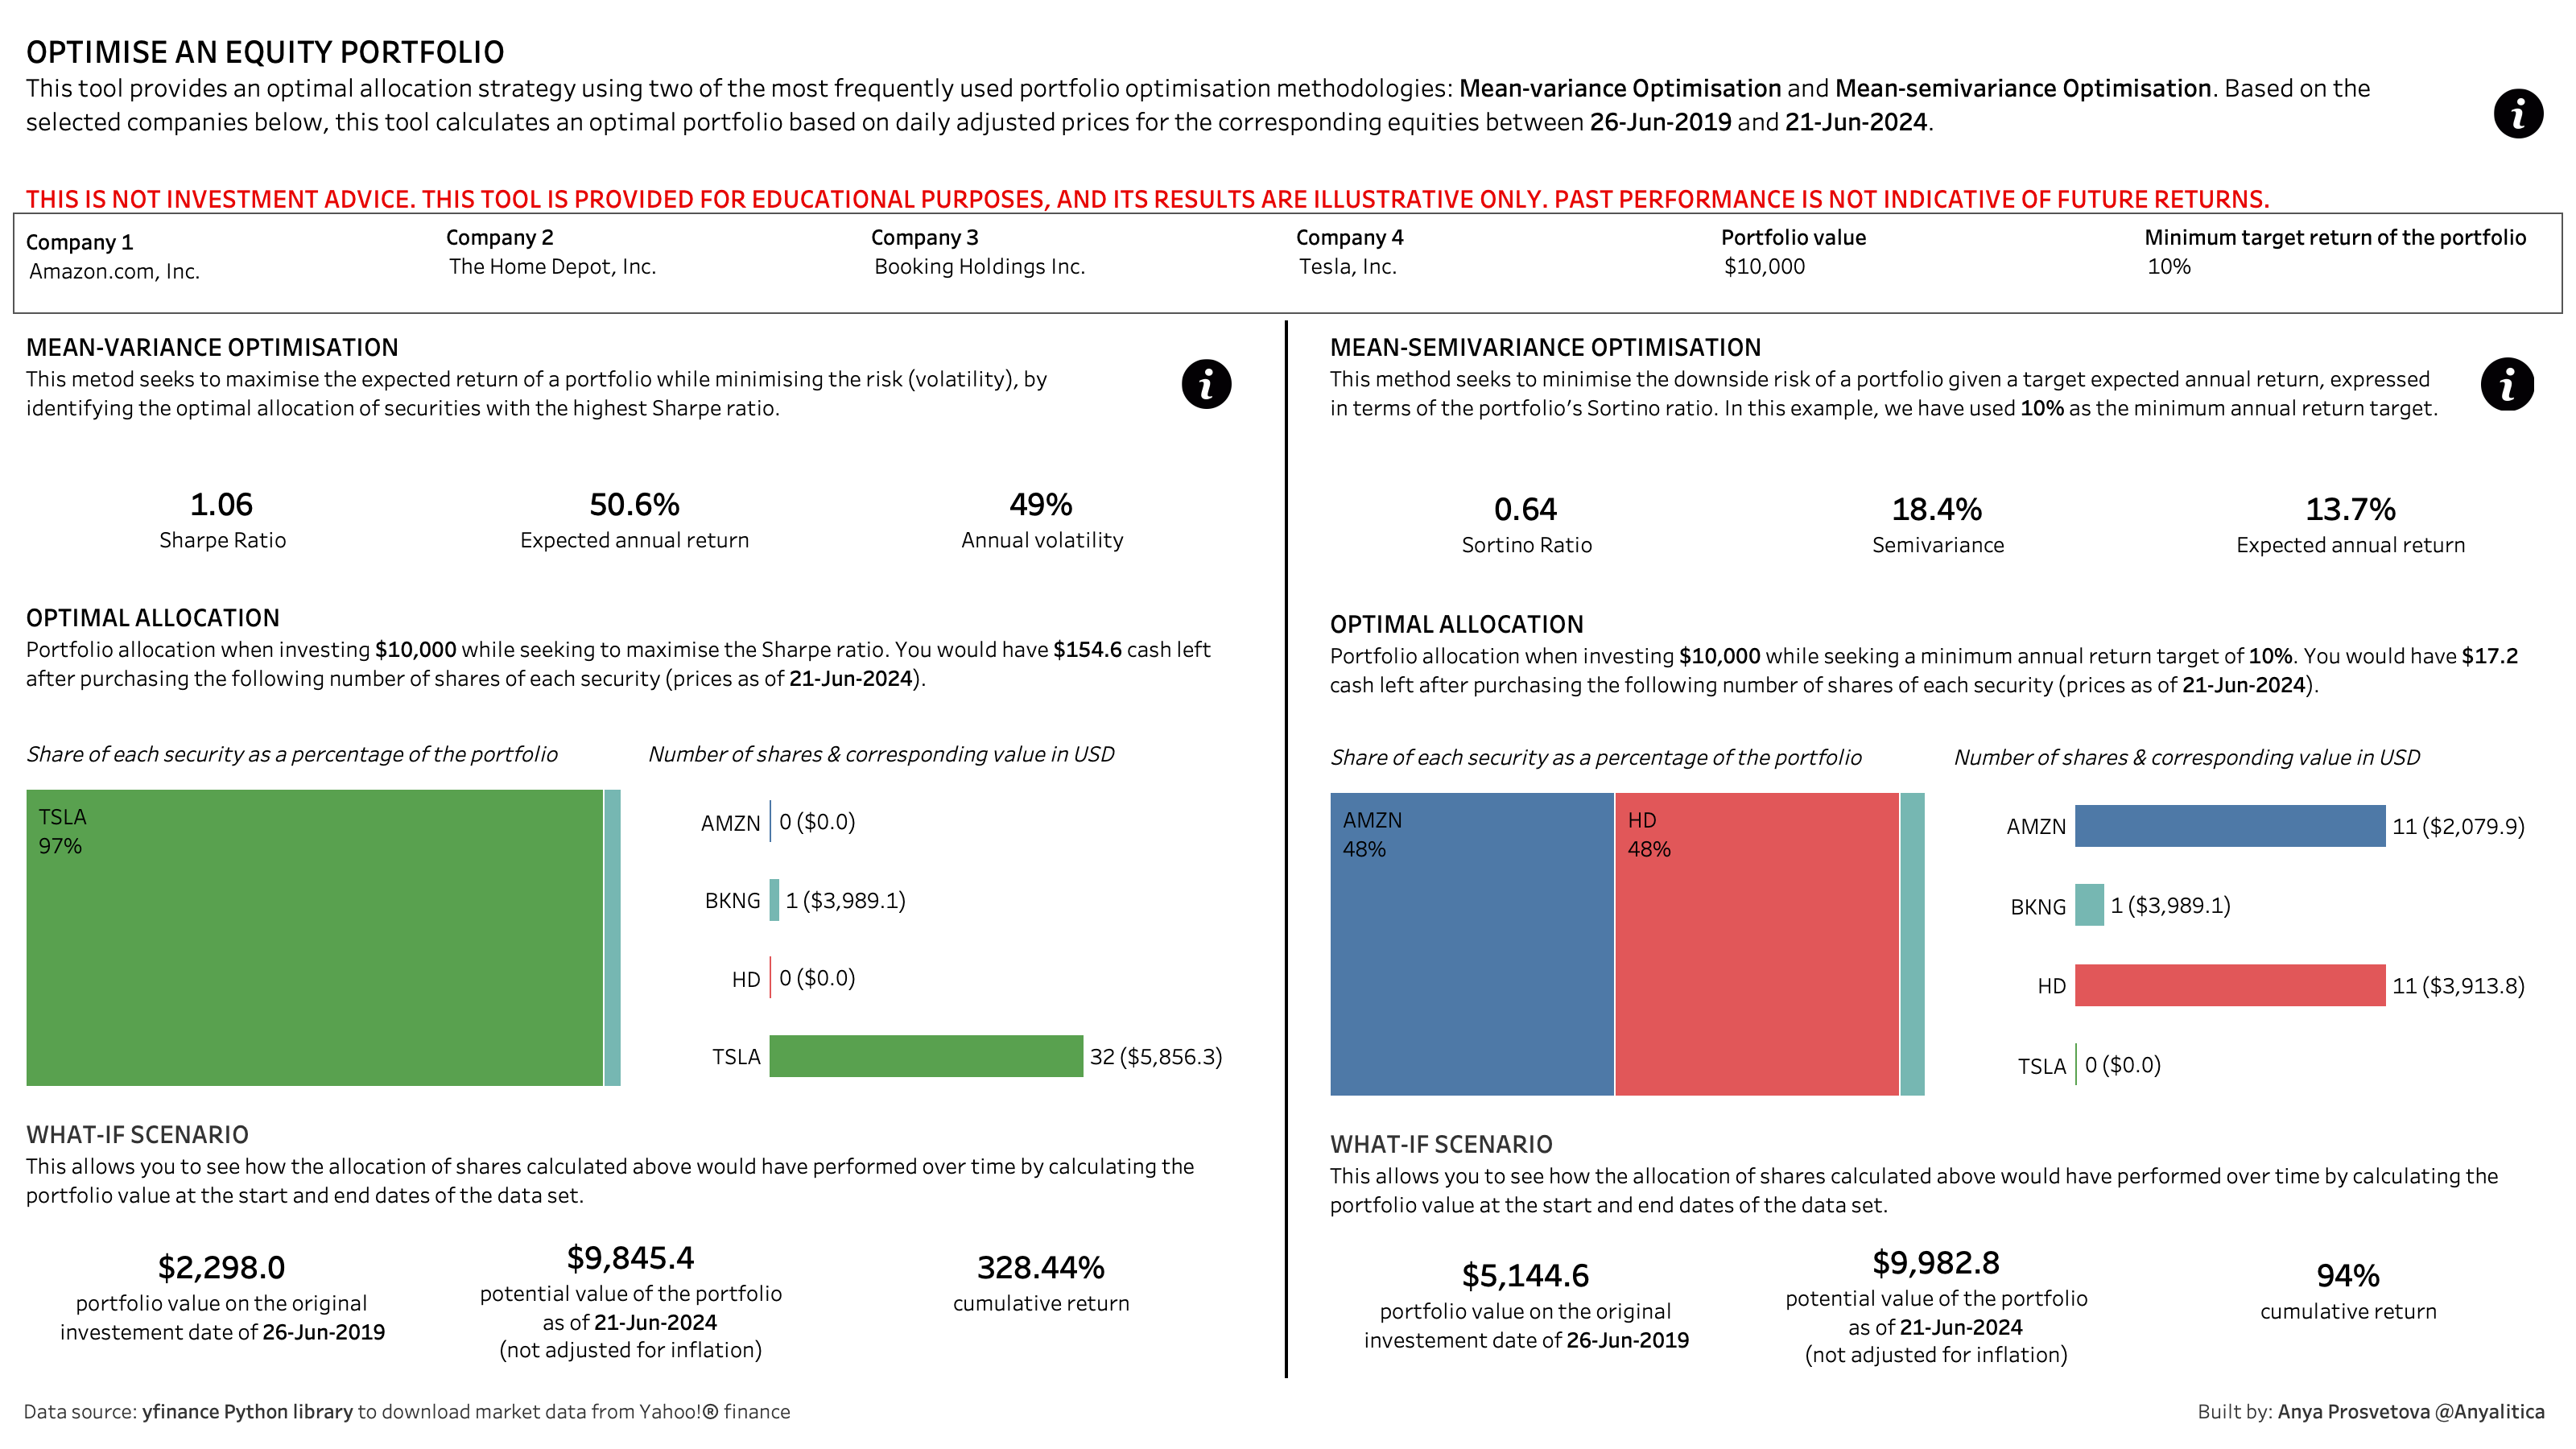
Portfolio optimisation dashboard
How it works: a look under the hood
The architecture of this tool combines Tableau’s visualization capabilities with Python’s computational power. Let’s break down the process:
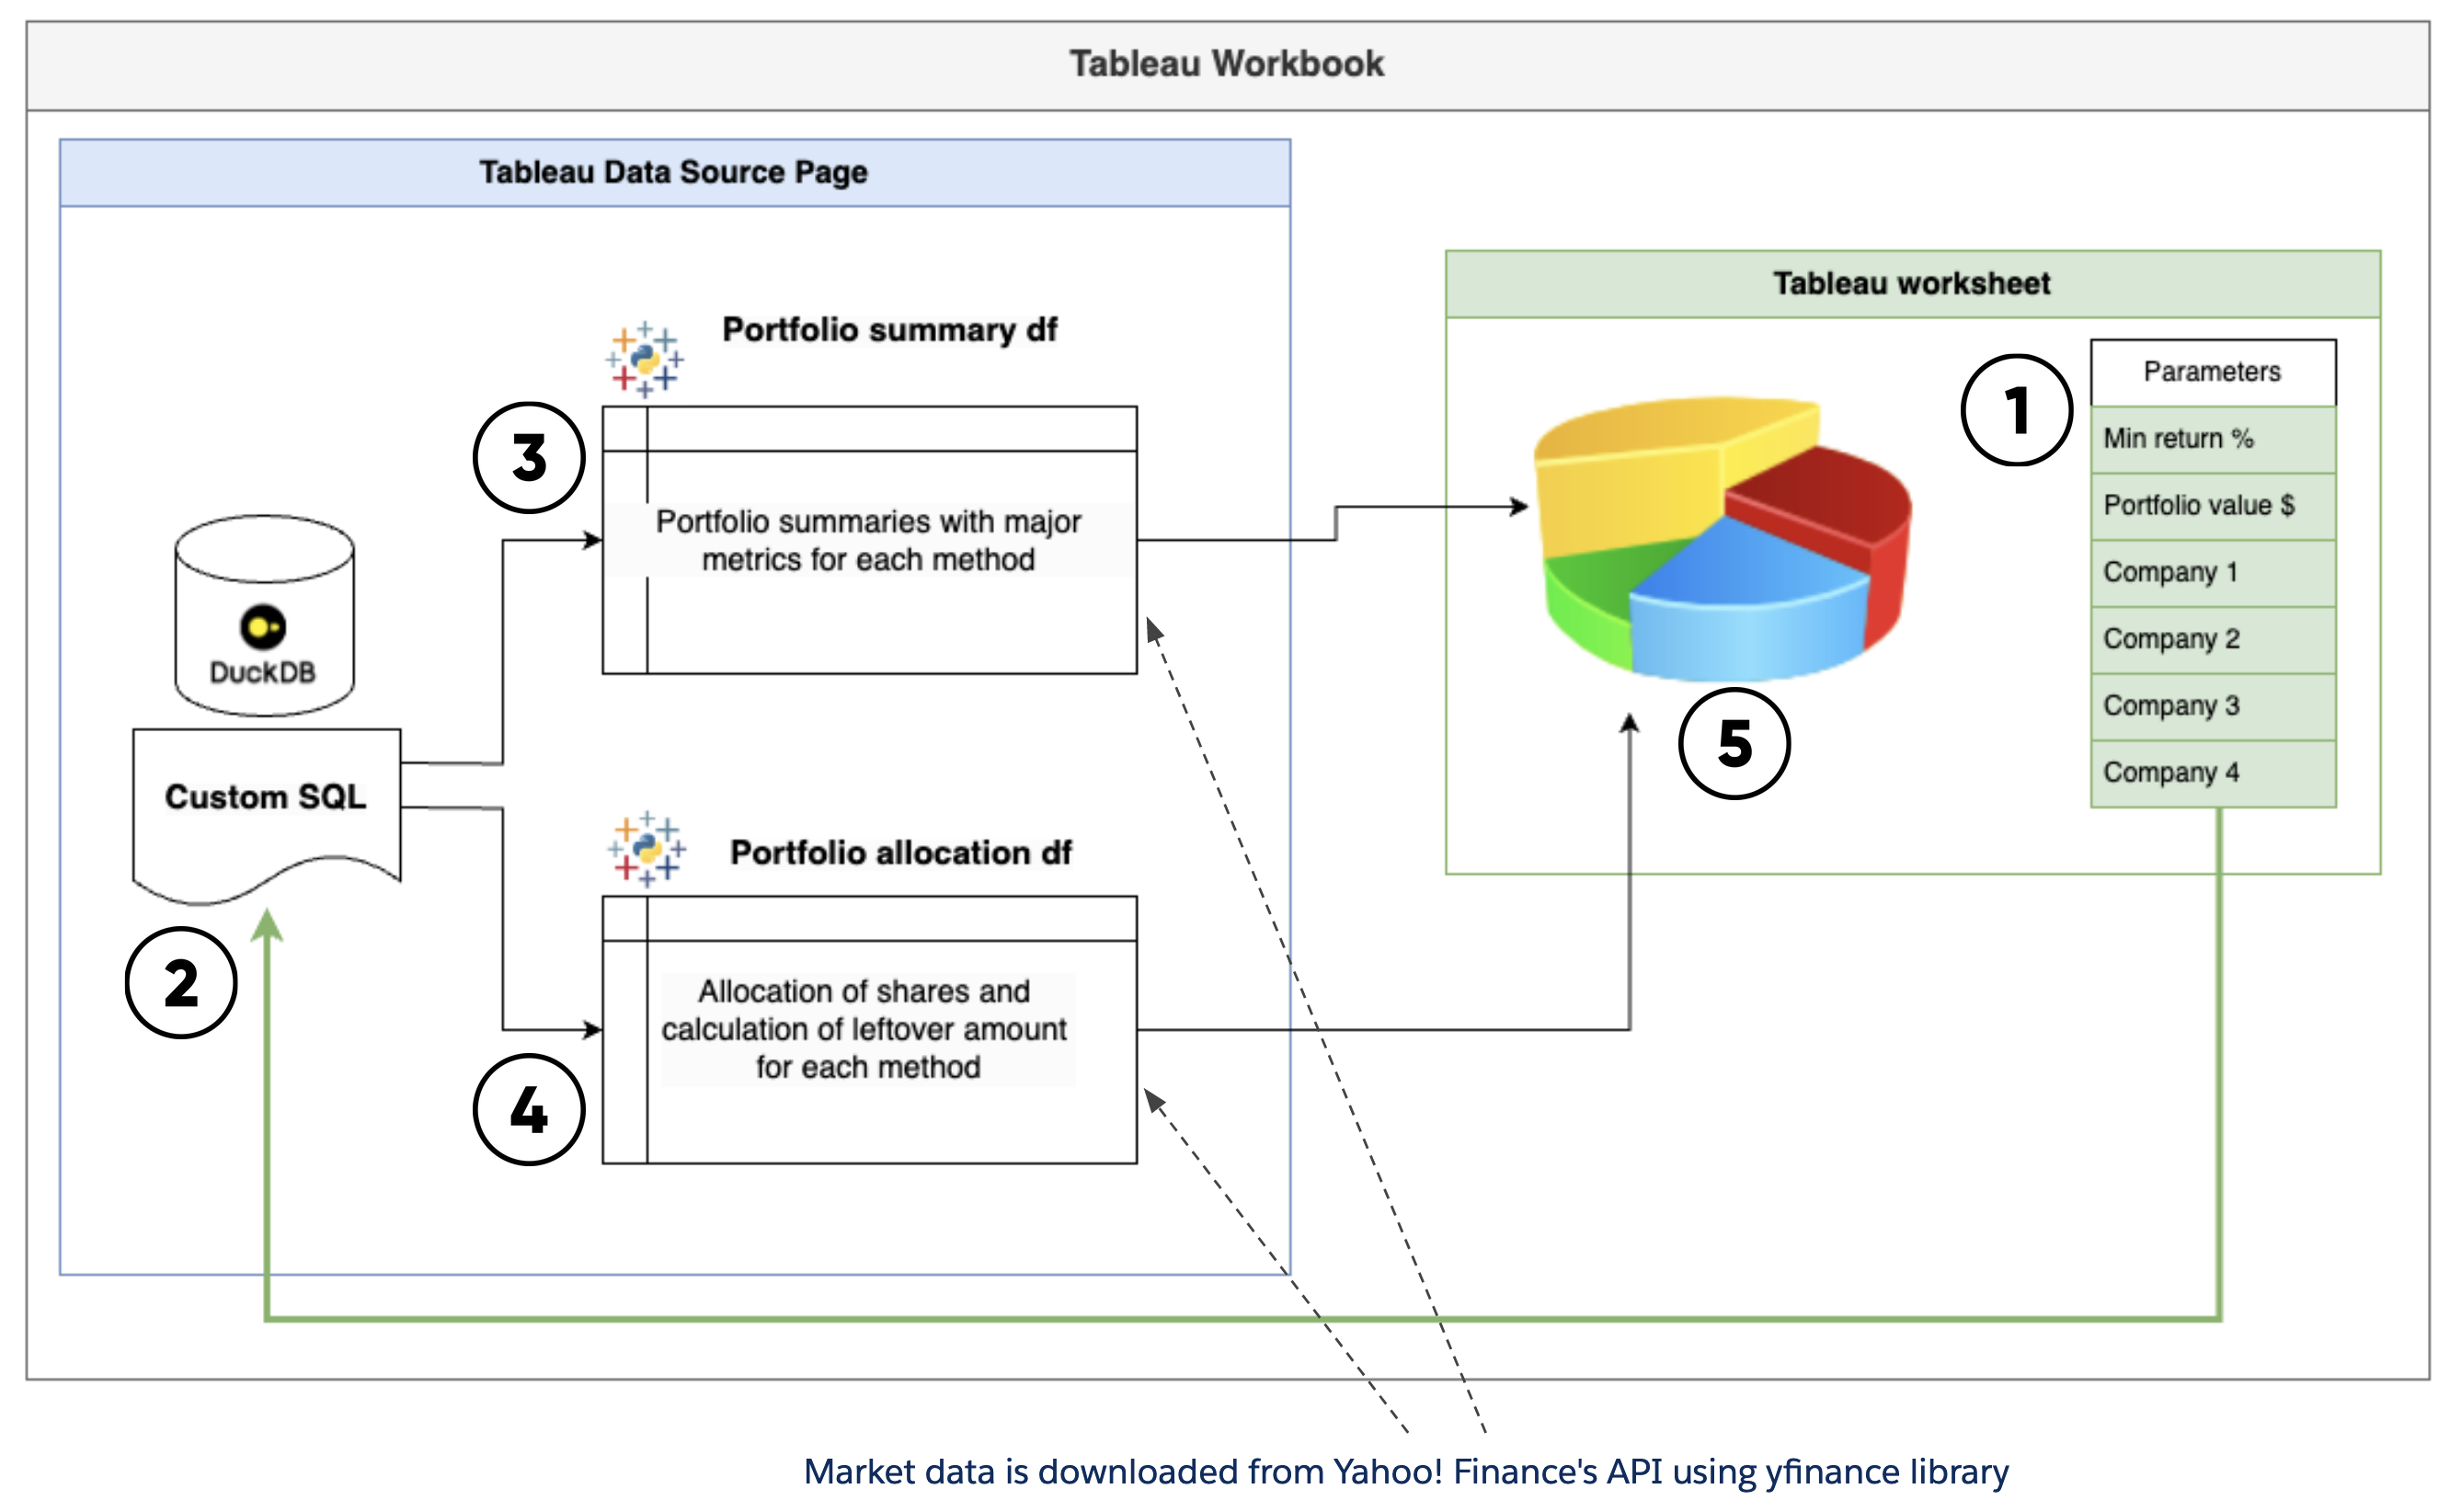
Current architecture diagram
-
User input: The journey begins with the user. On the dashboard, they select four companies they’re interested in and specify the amount they want to invest.
-
Table Extensions: Table Extensions allow us to create new data sources using Python scripts, which are executed via the TabPy server.
-
Dynamic parameters: This feature allows us to pass dashboard parameters directly to our Python script and regenerate the output on the fly.
-
Modelling in Python: Behind the scenes, our Python script takes these inputs and performs complex calculations using PyPortfolioOpt Python library to determine the optimal portfolio allocation.
-
Visualization of results: Finally, the Python script’s output is presented in an easy-to-understand Tableau dashboard.
The role of DuckDB: enabling Custom SQL
To make this all work seamlessly, I needed to enable Custom SQL functionality in Tableau. This is where DuckDB comes into play. DuckDB is a lightweight, embeddable SQL OLAP database management system that I’m using as a bridge to enable Custom SQL in the Tableau workflow.
If you’re new to DuckDB, they offer an excellent intro for beginners. For those looking to replicate this project, you can find detailed documentation on connecting DuckDB to Tableau on their website, and download the DuckDB file that I created directly from the project’s GitHub repository.
Custom SQL configuration: the engine behind the dynamic interaction
Once connected to DuckDB, I created a new Table Extension and added a Custom SQL query as an input for the extension. This query includes only the parameters we want to pass from the dashboard to the Table Extension. To pass these parameter values to my Python script in the Table Extension, I called the input table produced by the Custom SQL query as _arg1 in the code, and converted it to a Pandas dataframe.
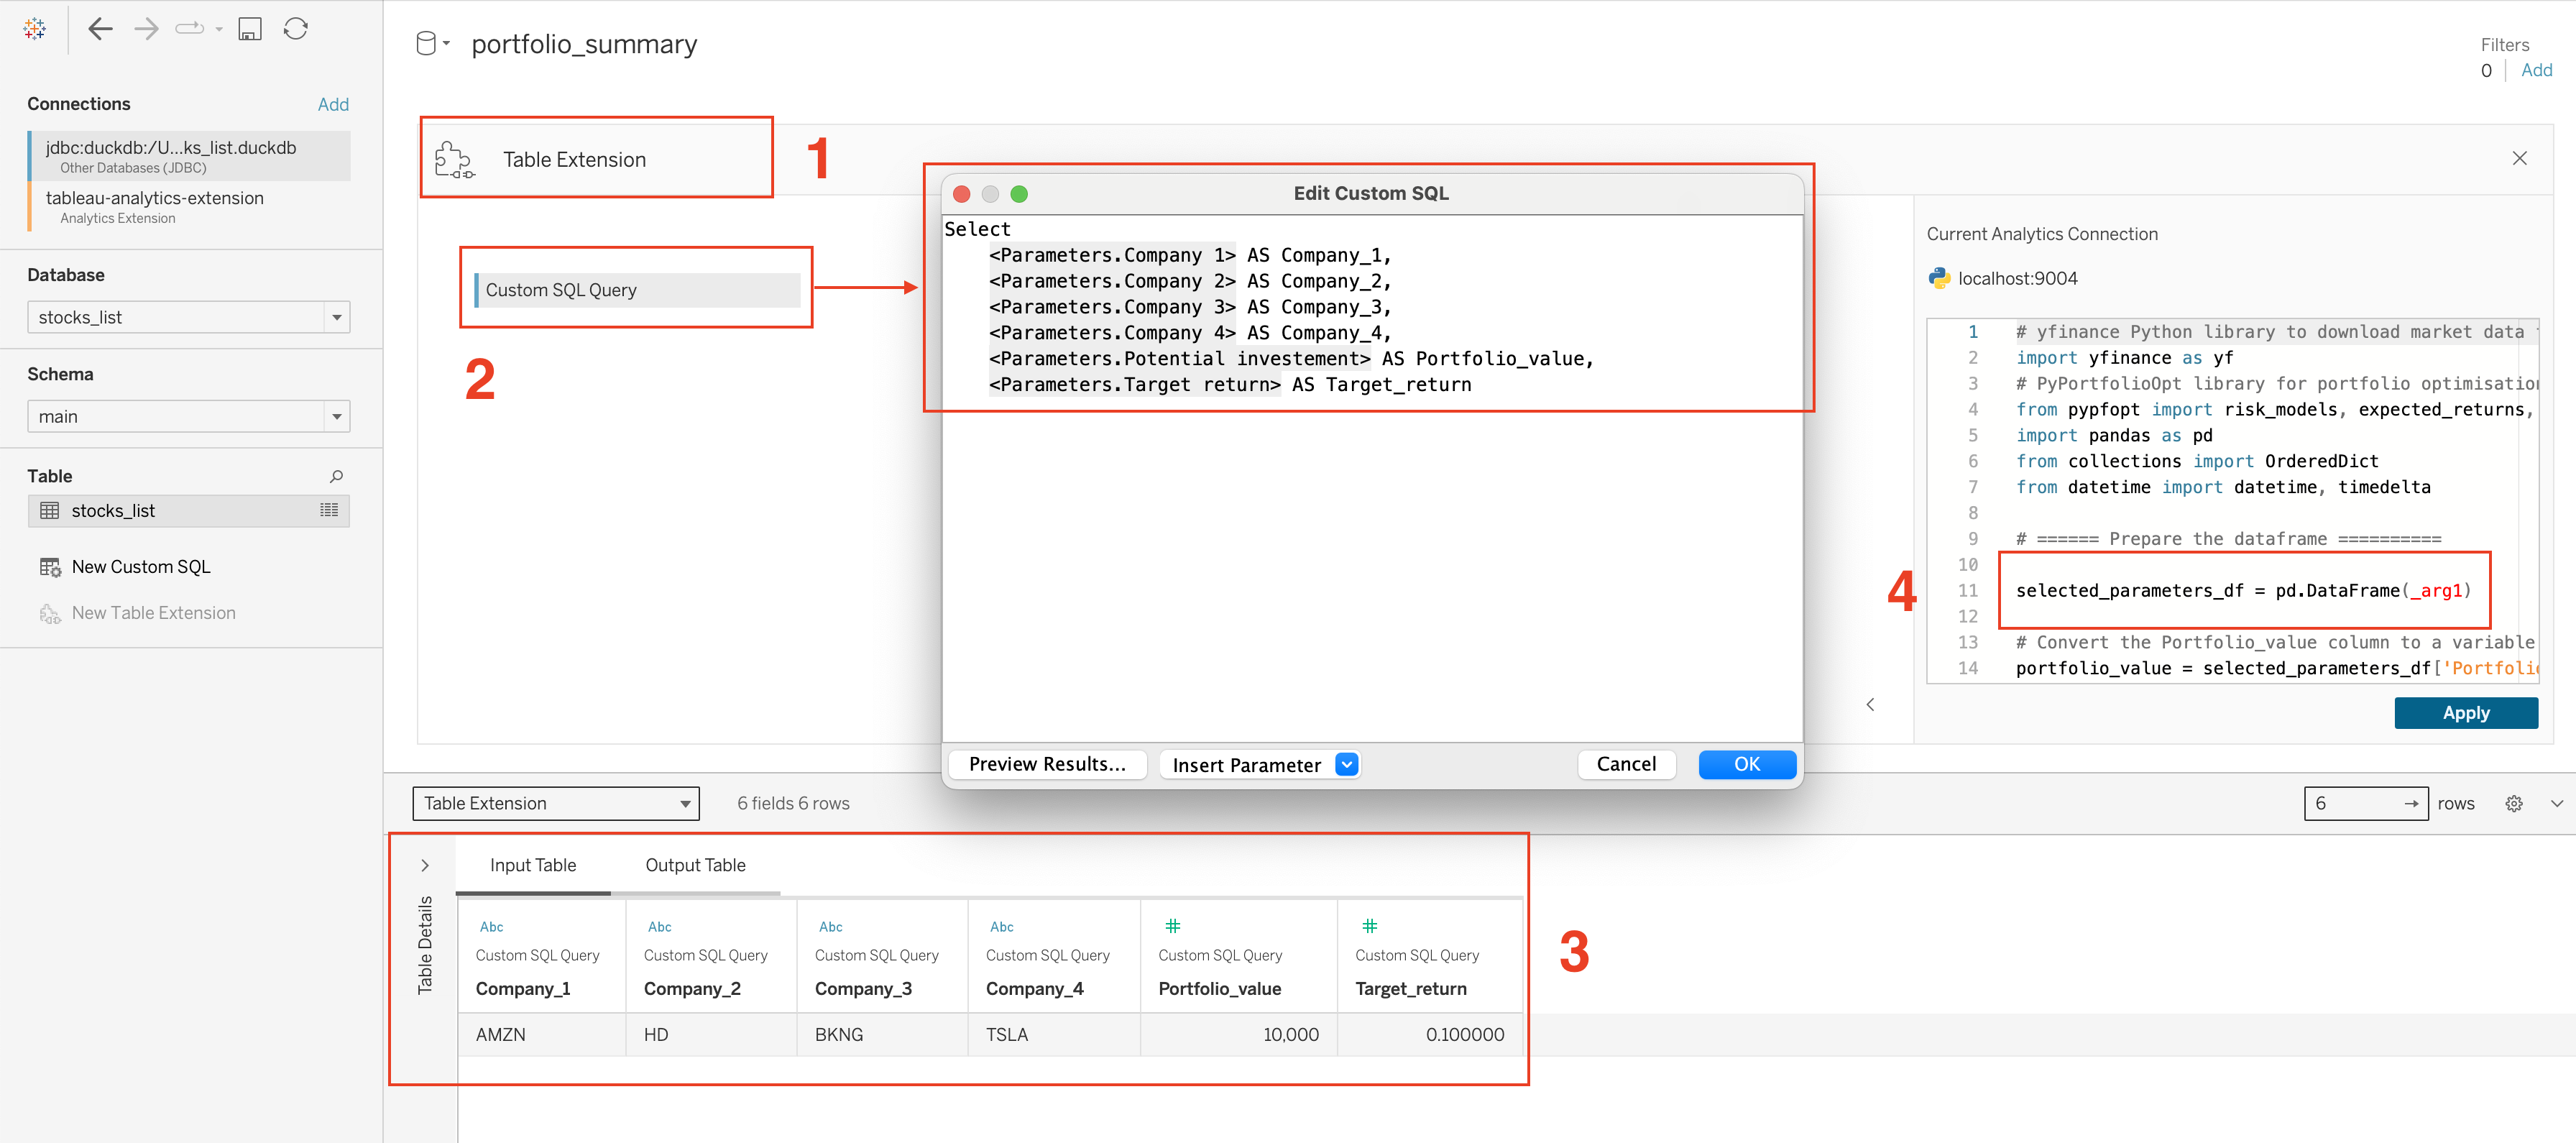
Custom SQL configuration
If you need to pass values from your SQL database to the Table Extension, you can include them as well in the Custom SQL query. However, complex SQL queries and large amounts of data extracted from the database can negatively impact your dashboard’s performance.
The output: making sense of the data
In this project I created two Table Extensions with 2 different Python scripts. These extensions generate two datasets that power the dashboard:
- Portfolio Allocation dataset
This dataset provides a detailed breakdown of how many shares of each selected company a user should consider buying, along with any leftover amount based on the specified portfolio value.
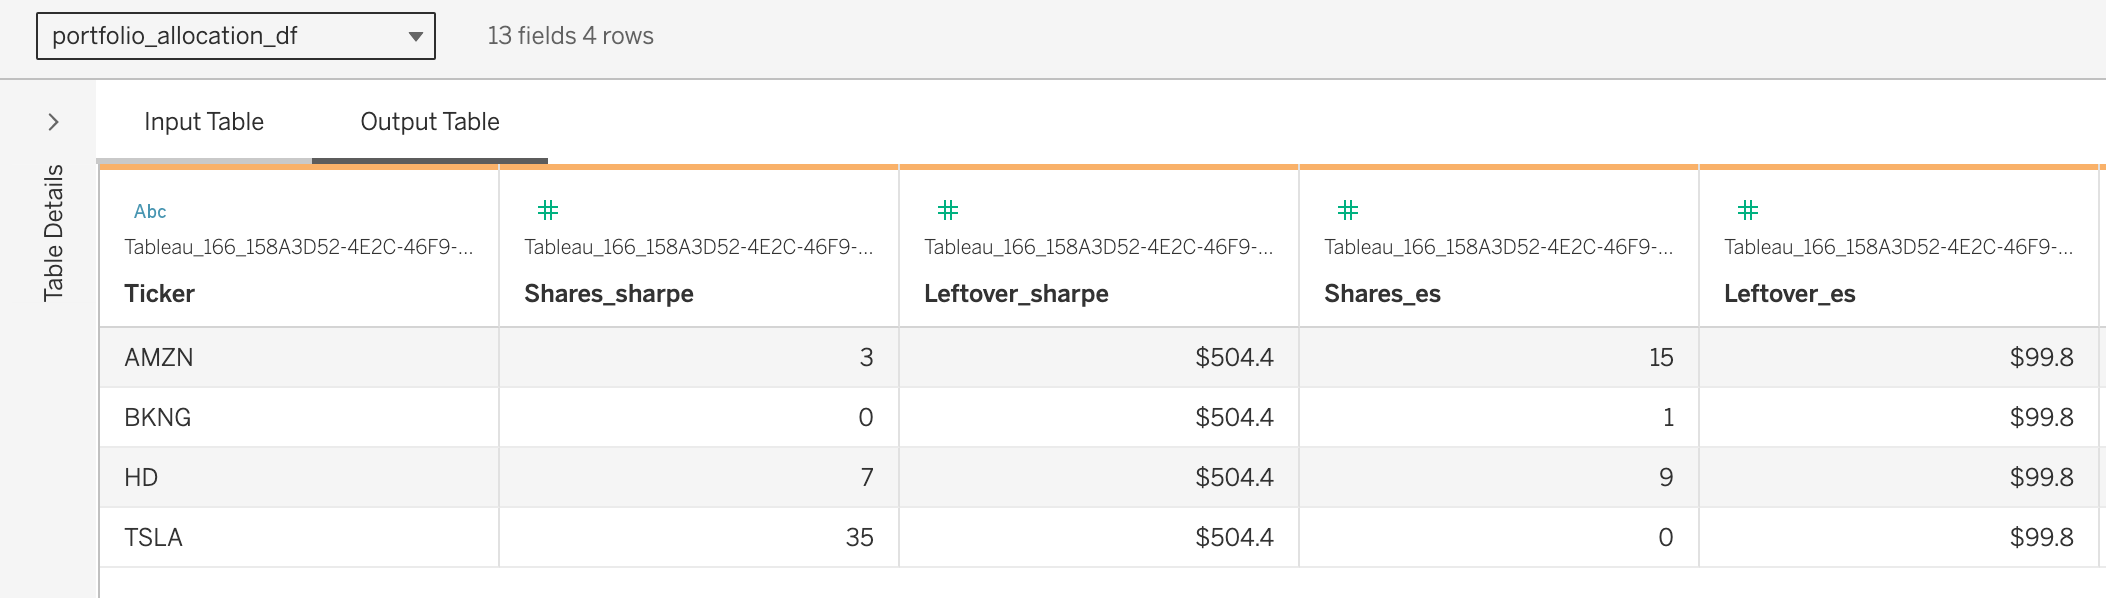
Portfolio allocation sample
- Portfolio Summary dataset
For each optimisation method, this dataset returns a set of crucial metrics including Sharpe ratio, Sortino ratio, expected annual return, semivariance, and annual volatility.
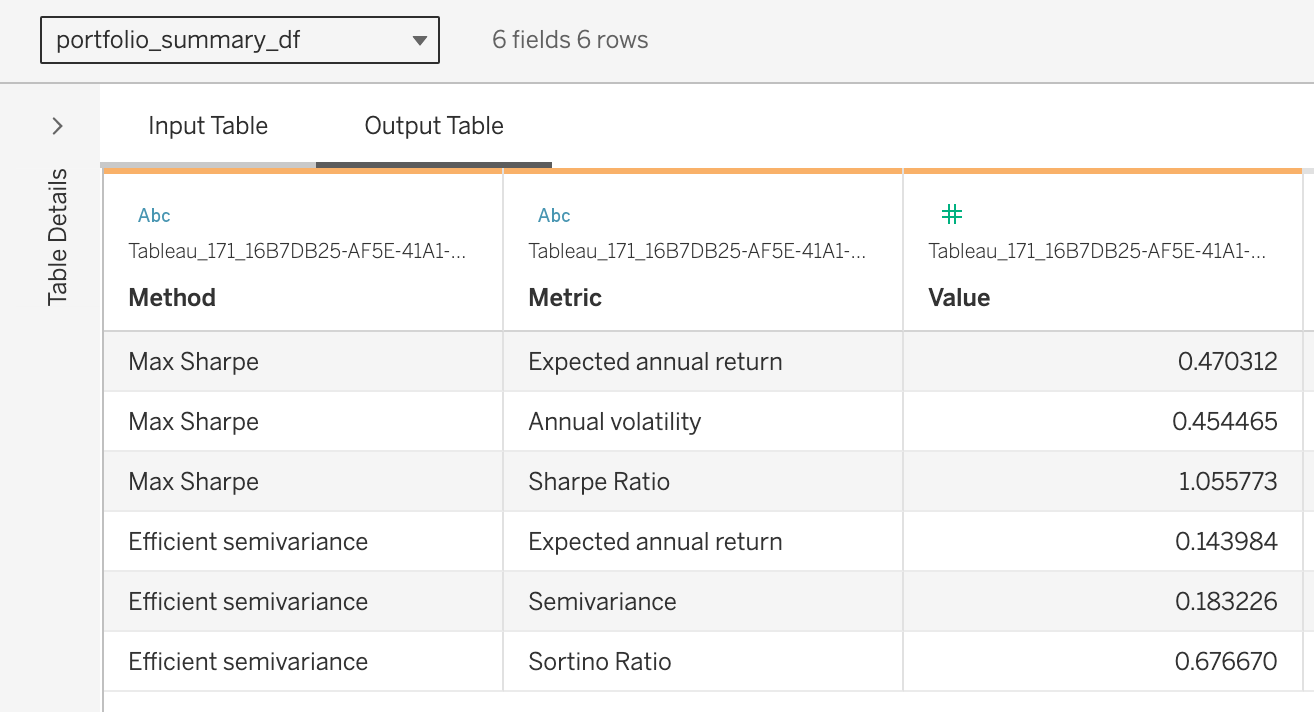
Portfolio summary sample
The final Python scripts that that are used in this project can be found in the python_scripts folder of the project’s GitHub repository. It’s worth noting that these scripts are tailored specifically for Tableau’s Table Extensions and won’t run correctly outside of this environment.
To be continued
Are you interested in learning more about the architecture and implementation details of this project? Watch the recording of my DataDev Day presentation and stay tuned for more blog posts about working with Python and Table Extensions in Tableau.