Preppin' Data 2020: Week 7 challenge solution
Here is my solution for Peppin’ Data 2020, Week 7. This week we are looking at how to count existing employees and their aggregated salaries on a monthly basis, taking into consideration people who left the company.

My solution in Tableau Prep
Original challenge and data set on Preppin’ Data’s blog.
Step 1: Combining data sets on current employees and leavers
There are two starting tables for this challenge as shown in the image below, and we need to combine them together to produce the monthly summary of salaries and current employees.

Original tables with current employees and leavers
To do so, first I added the Cleaning step after inputting the Current employees table, and wrote a calculated field called Leave Date that is simply a date: 1st of March 2020. As part of the challenge, we were given this hypothetical leave date in the future (at the time of writing) for current employees that are yet to leave. We will use this date in our calculations later on:
#2020-03-01#Next, we need to combine these two tables using the Union step. Notice that since we called the new field in the Current employees table exactly the same as in the Leavers table, all fields in our tables should correctly match in the Union step.
Now we need to extract join and leave months from the Join Date and Leave Date fields as the end report should be aggregated on a monthly level. To do so, we need to write two new calculated fields:
Join month
DATE(DATETRUNC('month', [Join Date]))Leave month
DATE(DATETRUNC('month', [Leave Date]))I wrapped the DATE function around the DATETRUNC function here, so the result of the calculation is of the Date data type rather than the Date & Time format.
The last step here is to create another calculated field that is called Join field and is equal to '1'. We will see why and how it will be useful for us in Step 3 below.
Step 2: Preparing the list of reporting dates
Now let’s look at the third table we have as an input for this challenge - Reporting Date Input. This is just a list of months for which we need to report total salary and the number of current employees for a particular month. This third table should now be joined with the combined table of employees from Step 1 above so that we could calculate the monthly numbers.
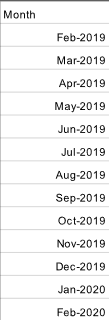
To do so, we need to add the Cleaning step and create the same calculated field as in the combined table which is called Join field and is equal to '1'.
Remember to change the data type of the Month field to Date before moving further.
Step 3: Creating the structure of the report using the scaffolding technique
Now we can join the combined table with all employees and the list of reporting dates together, adding the Join step and selecting our Join field fields as the join clause.
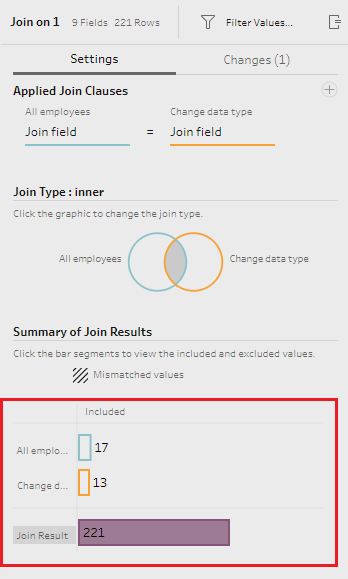
Join step settings
As each row in each table has the same value in these fields, i.e. '1', each row from the reporting dates table appends to each row from the employees table. Note the join result in the image above is a multiplication of the number of rows from both tables: 221 = 17*13.
If we look at one month from the reporting dates table, we will see that it has rows with information about all 17 employees attached to it now. That allows us to proceed with calculating totals for a particular reporting month.
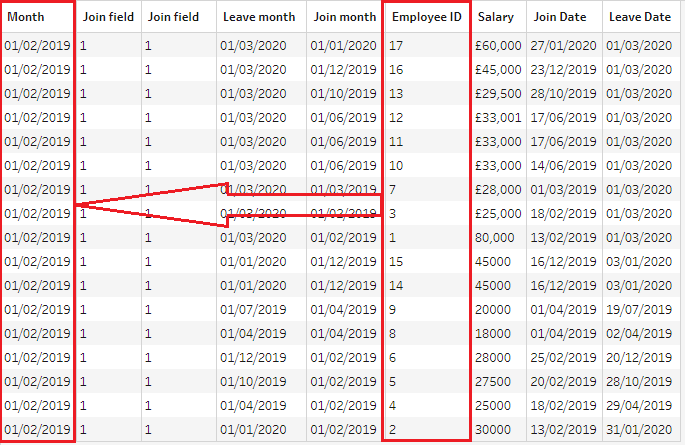
All employees appear in February 2019...
At the same time, each employee appears in every reporting month:
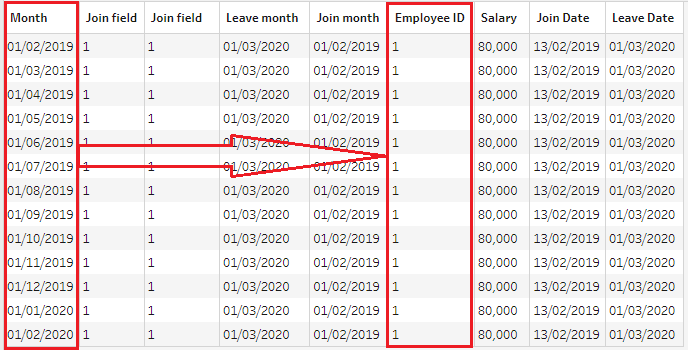
...and each employee appears in all months.
This technique is called ‘scaffolding’ and can be very useful when you need to interpolate values between rows in a dataset. In this challenge, we have the join and leave date for each employee, but we need to create a row for each month between these two dates to calculate monthly totals.
Now that we have all our data in one table, we can safely remove Join field fields from our dataset and proceed with calculations of monthly totals.
Step 4: Cleaning the Salary field
As you may notice, some rows in the Salary field have the ‘£’ sign which needs to be removed to use these numbers in calculations. To do so, I added the Cleaning step after the join and created a new calculated field called Salary which will update the values in the existing Salary field:
IF CONTAINS([Salary], "£") THEN MID([Salary], 2) ELSE [Salary] END Here we want to identify all cases where the Salary field contains ‘£’, and if it’s true, then apply the function MID to extract all characters from the field, starting from the 2nd character in this string. Now that the Salary field is clean, we need to change its data type to ‘Number (whole)’.
Step 5: Identifying which salary and employees to include in totals
It would be an easy solution to jump straight into aggregation of monthly numbers, but we need first to understand which employees worked in a particular reporting month before finding totals. Otherwise, we will add up salaries of people who either had not joined the company in a given month or had already left.
Let’s add a new Cleaning step and create two calculated fields:
Salary for this month
IF [Leave month]>[Month] AND [Join month]<=[Month] THEN [Salary] ELSE NULL ENDEmployee for this month
IF [Leave month]>[Month] AND [Join month]<=[Month] THEN [Employee ID] ELSE NULL ENDThese calculations will keep the values we need to aggregate, and will remove the values related to employees who didn’t work in a particular month. Now we can filter out all NULL values from either the Salary for this month or Employee for this month field to have a clean table ready for aggregations.
Step 6: Calculating monthly totals
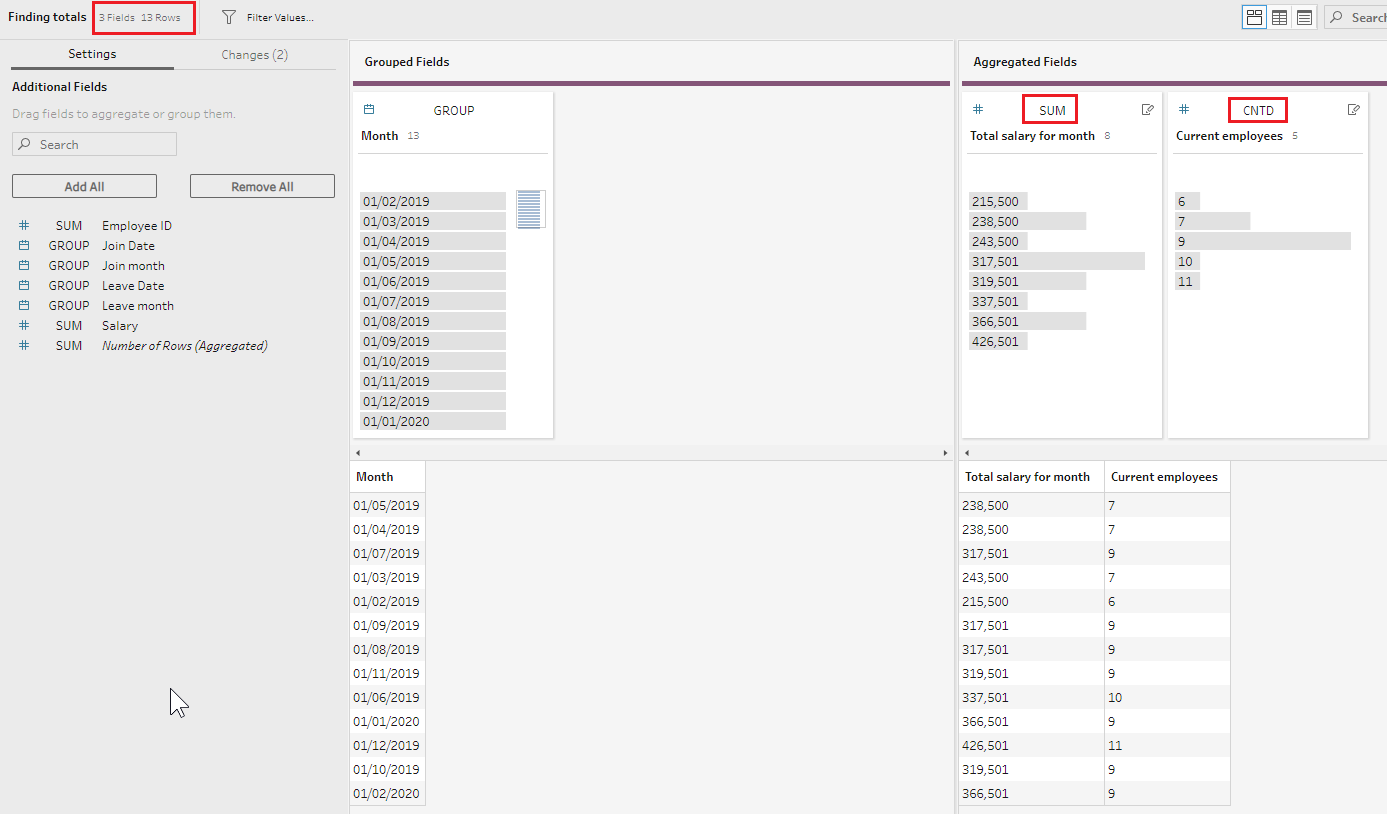
Finally, we have our data ready for aggregation. Let’s add the Aggregate step, and apply SUM aggregation to the Salary for this month field, CNTD (count distinct) aggregation to the Employee for this month field, grouping the results by the Month field.
I also renamed these fields as Total salary for month and Current employees to reflect the required output’s structure. Notice that we are now back to 13 rows, the same number as in the original reporting dates table.
Step 7: Calculating the average salary per current employee
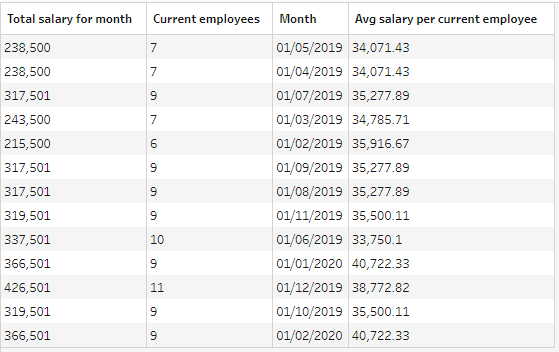
Now we have only one field missing from the final report - the average monthly salary per current employee in a given month. To calculate it we need to create a calculated field called Avg salary per current employee:
ROUND([Total salary for month]/[Current employees],2)The ROUND function here rounds the calculated number to two decimal points.
And our final output is ready:
And here is the completed flow for this challenge which you can download from my GitHub repository:

Let me know if you have any questions.